Ines Baumann · 28 October 2026
School Curriculums Now Track Emission Drops Using Sensor Networks Along Protected Routes
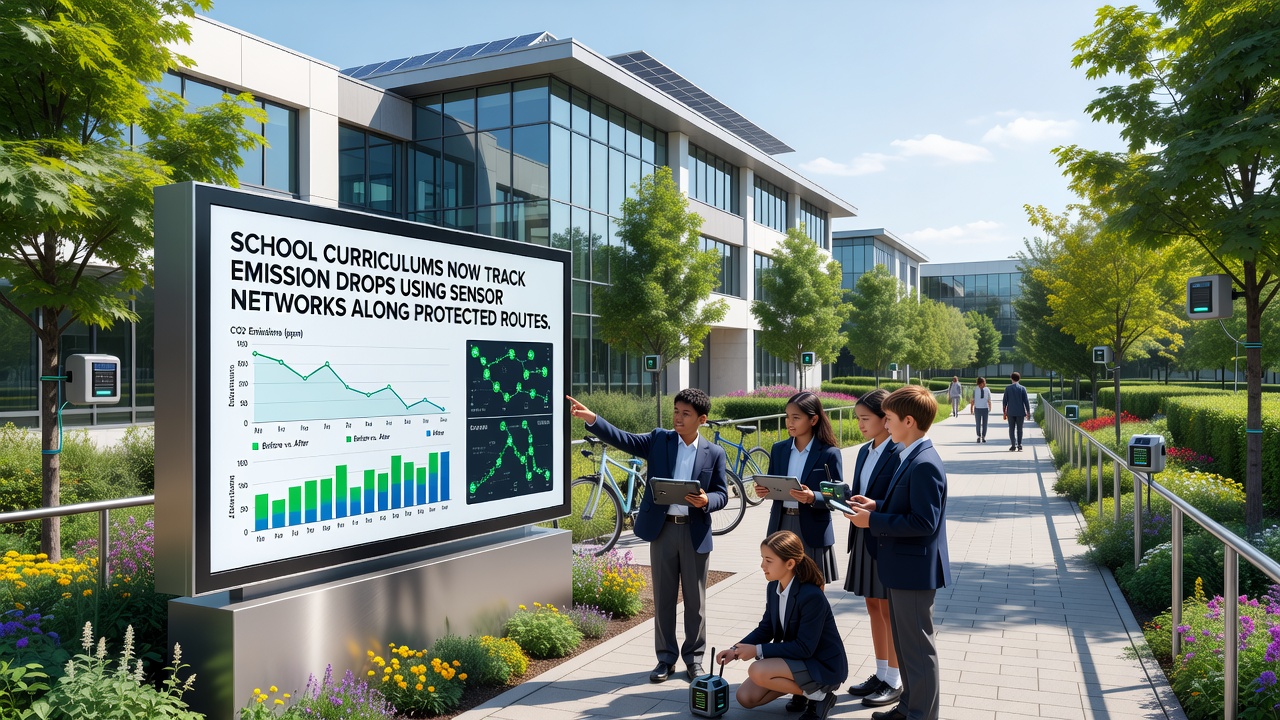
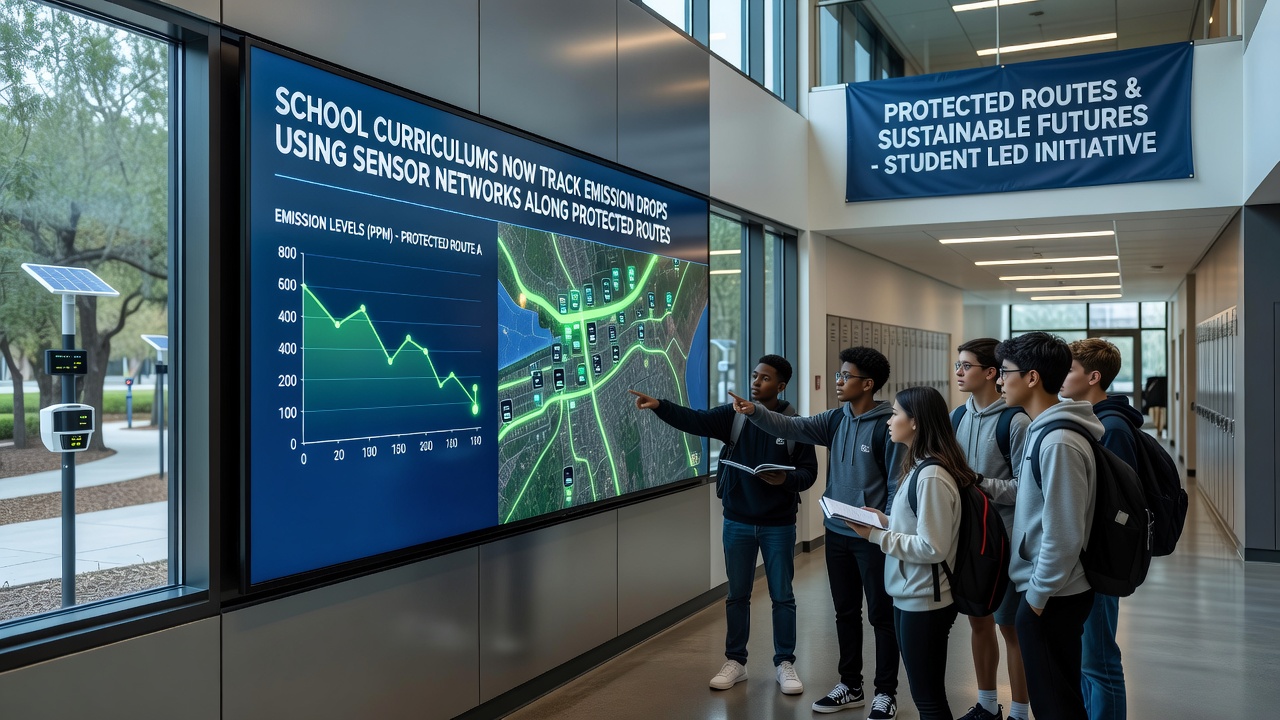
School curriculums incorporate sensor networks positioned along protected routes to monitor emission reductions and supply students with live environmental datasets for classroom study. These systems measure pollutants such as carbon dioxide and nitrogen oxides while recording traffic patterns and weather variables that influence air quality along designated low-impact corridors. Data streams feed directly into lesson plans where students examine trends over weeks and months to identify correlations between route usage and emission levels.
Programs launched in multiple regions place the networks at intervals of several hundred meters to capture granular readings. Students access dashboards that display hourly fluctuations and they compare figures against baseline measurements collected before route protections took effect. This setup allows classes to calculate percentage drops in specific emissions and to map changes across seasons without relying on estimated models alone.
Sensor Technology and Data Collection Methods
Each station combines electrochemical sensors for gas detection with optical particle counters and anemometers that track wind speed and direction. Readings transmit via cellular or LoRaWAN connections to central servers where algorithms flag anomalies and generate automated reports. Maintenance crews calibrate units quarterly to maintain accuracy within two percent of reference standards set by environmental agencies.
Protected routes typically span urban green belts and rural conservation areas where vehicle access faces restrictions or time limits. Networks along these paths record lower average emission concentrations compared with adjacent highways and the differences become teaching material for geography and science modules. One installation near a European nature reserve logged a 28 percent reduction in particulate matter after enforcement of access rules began in early 2025.
Curriculum Integration Across Subjects
Mathematics teachers use the datasets to teach statistical analysis while students calculate confidence intervals around emission averages and create regression models that predict future trends. Biology classes examine how reduced emissions correlate with vegetation health indicators collected by the same sensor array. History lessons incorporate the timeline of route designations to illustrate policy impacts on local environments.
Computer science modules focus on data visualization techniques where learners build their own interfaces to display subsets of the information. Schools coordinate with network operators to receive anonymized raw files that comply with privacy regulations yet retain enough detail for meaningful inquiry. Teachers report that real datasets increase engagement because students recognize the information reflects conditions near their own communities.
Examples from Ongoing Implementations
A district in Canada integrated sensors along a protected cycling corridor and linked the output to middle-school environmental science units. Students tracked a 19 percent drop in nitrogen dioxide during school hours after vehicle restrictions expanded in September 2025. Similar projects operate in Australia where coastal reserves host networks that feed data into secondary curricula focused on marine and atmospheric interactions.
European initiatives align with broader monitoring frameworks managed by the European Environment Agency and several national education ministries. These partnerships supply standardized data formats that allow schools to compare results across borders. One collaborative project between three countries produced a shared repository where classes upload their analyses and receive feedback from researchers who maintain the sensor infrastructure.
October 2026 Expansion Plans
Additional sensor deployments scheduled for October 2026 will extend coverage to fifteen new protected routes across participating regions. Education departments plan to update curriculum guidelines to include modules on machine learning applications for emission forecasting. Funding from environmental grants covers equipment costs while teacher training programs emphasize interpretation of high-frequency sensor outputs.
Observers note that the expanded networks will increase the volume of available data by roughly 40 percent and this growth supports more advanced statistical exercises in advanced placement courses. Coordination meetings between schools and technical teams occur quarterly to address calibration issues and to incorporate student suggestions for new measurement parameters.
Conclusion
Sensor networks along protected routes supply measurable emission data that schools now embed into multiple subject areas. Students work with actual readings to quantify reductions and to explore connections between policy decisions and environmental outcomes. Continued expansion through 2026 will broaden access to these resources while maintaining the focus on verifiable measurements collected under consistent protocols. The approach demonstrates how infrastructure originally designed for regulatory compliance can serve educational purposes without additional interpretation layers.